Rise Of Twitter Infographic
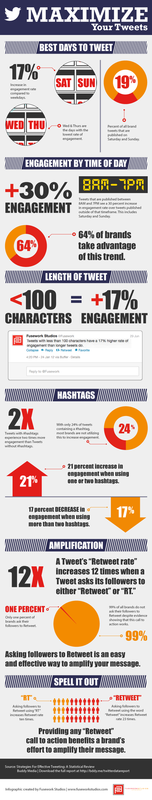
Buddy Media recently published a report titled “Strategies for Effective Tweeting: A Statistical Review.” The report is based on the data compiled from their analysis of user-engagement from over 320 Twitter profiles managed by various brands. Based on their data they make several recommendations for how best to maximize the use of Twitter as a business.
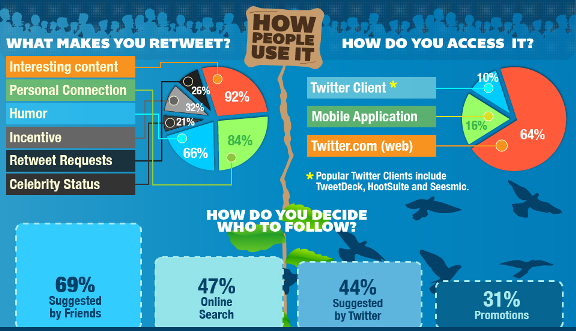
After reviewing the study they decided to convert it into an infographic using most of the data found within the report. They focused on using the data that relates to some of the most common questions we receive from clients about Twitter best practices, including: “When is the best time to tweet?” “How can I increase engagement and conversation?” “How can I get more people to retweet my tweets?” Buddy Media’s full report can be found at http://bddy.me/twitterdatareport. Please feel free to use and share this infographic by using the embed code below or at least providing a link back to this page. |
"The Who, Why, and How of Twitter"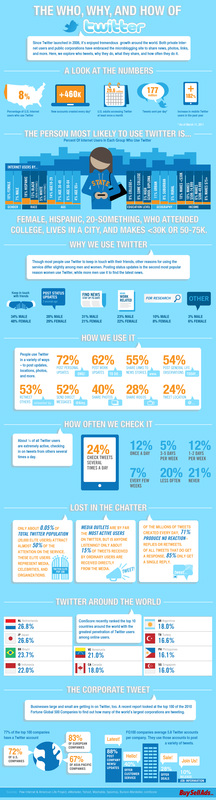
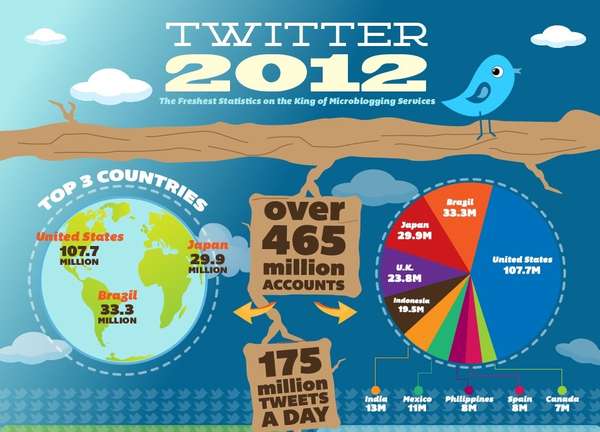
Within a few short years, Twitter has become a mainstay of the social media landscape. Media outlets, businesses large and small, and people around the world are talking about it. But who’s really on the microblogging service?
I explore who uses Twitter and how they use it in the infographic below. |